- Cardano was down by over 9% in the last 24 hours.
- Indicators hinted at a continued price decline.
After a massive price rise in the last 24 hours, Cardano’s [ADA] price registered a decline. The blockchain’s development activity followed a similar trend.
Cardano’s weekly development
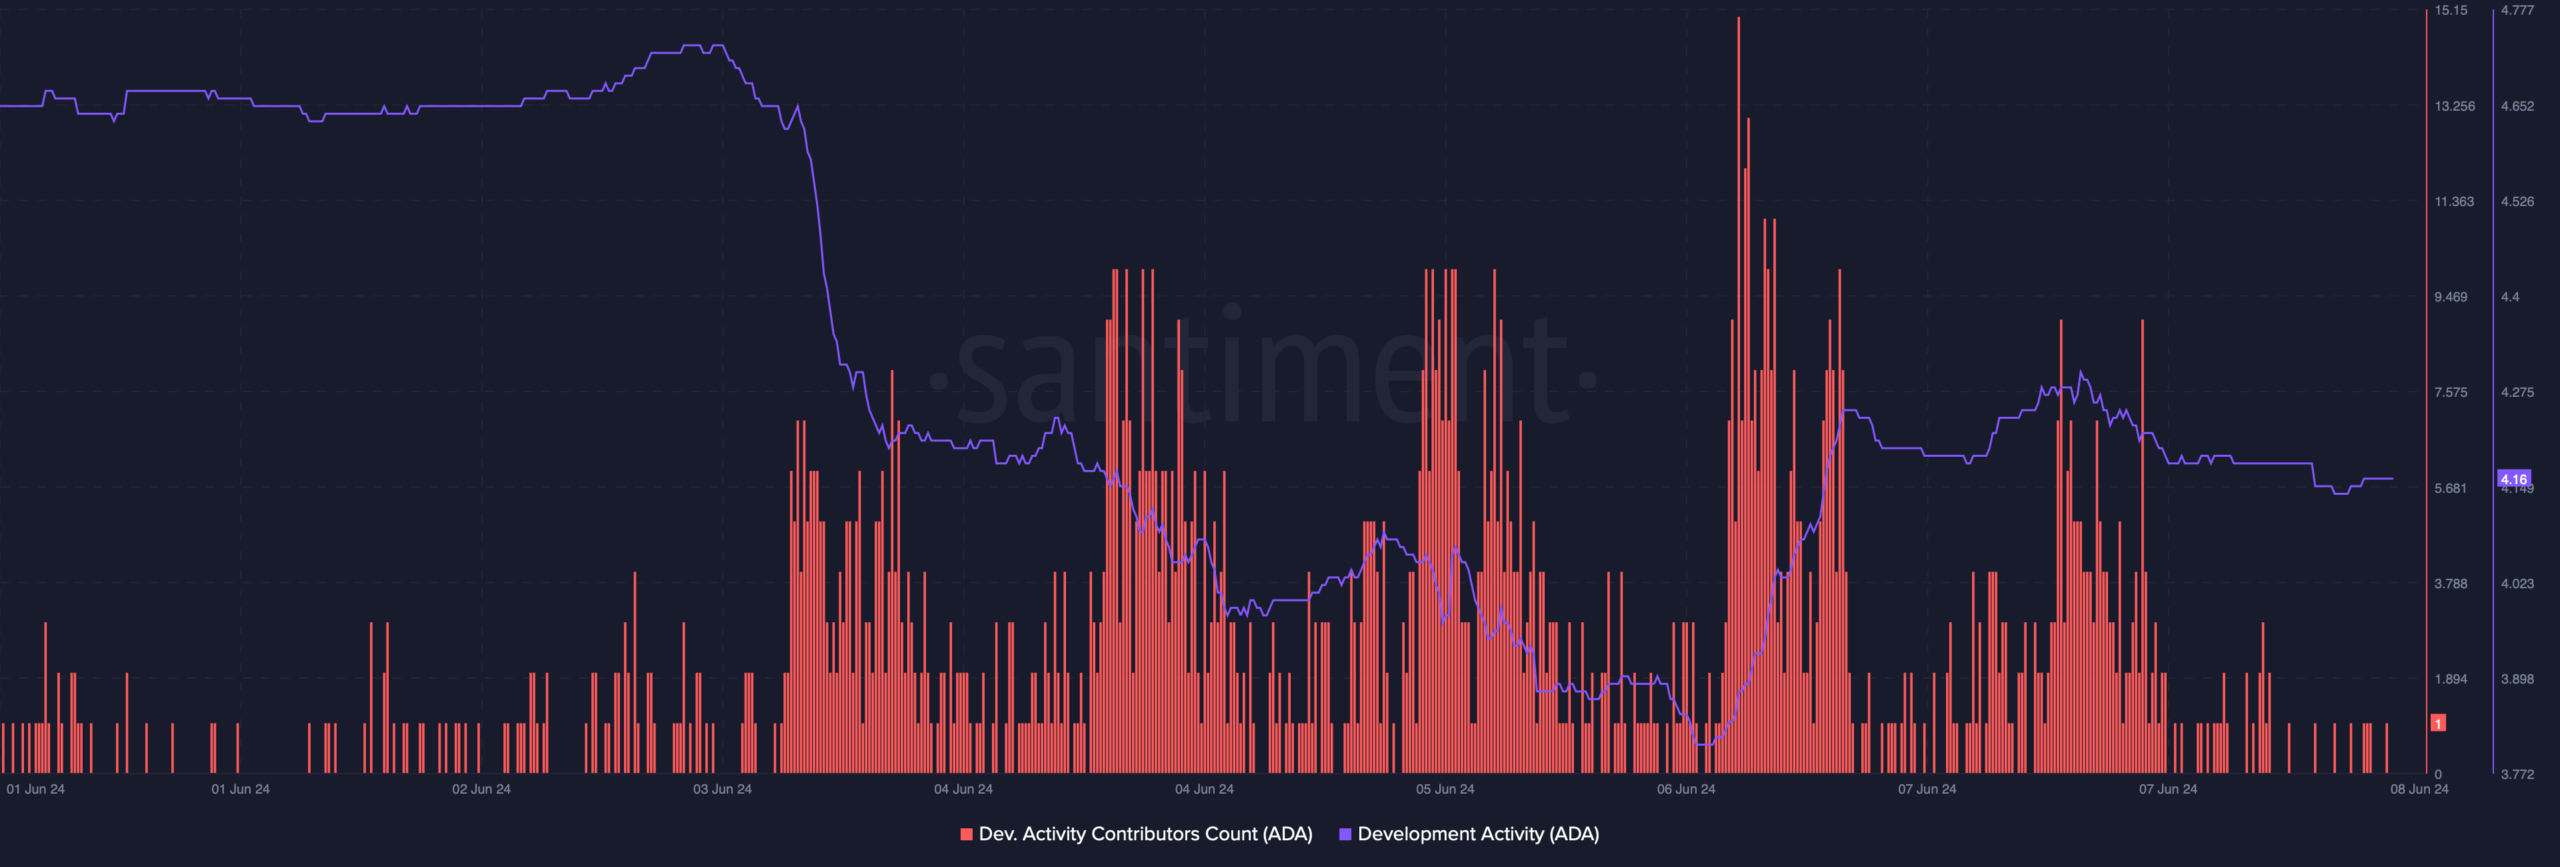
AMBCrypto’s analysis of Santiment’s data revealed that ADA’s Dev Activity Contributors Count remained high last week. However, its Development Activity dropped.


Source: Santiment
Alongside, Input Output Global posted its weekly development report, highlighting the work done by different Cardano teams.
As per the report, the Lace team released v.1.12, which comes packed with improvements and a major new feature that allows users to choose fiat currencies to fund their wallets via this service.
This week, the Plutus team released version 1.29.0.0 of the Plutus libraries, while the Mithril team continued implementing the certification of Cardano transactions in Mithril networks.
The report also mentioned the updated statistics of the Cardano blockchain. Cardano’s total number of transactions exceeded 91 million, while its number of native tokens also exceeded 10 million.
Additionally, 171 projects have been launched on the blockchain to date.
ADA turns bearish
While developers worked on multiple projects, ADA turned volatile.
The token’s price surged and touched $0.487 on the 8th of June, but the trend didn’t last. Soon after, the bears took over and pushed down the token’s price.
According to CoinMarketCap, ADA was down by more than 9% in the last 24 hours.
At the time of writing, the token was trading at $0.4354 with a market capitalization of over $14 billion, making it the 10th largest crypto.
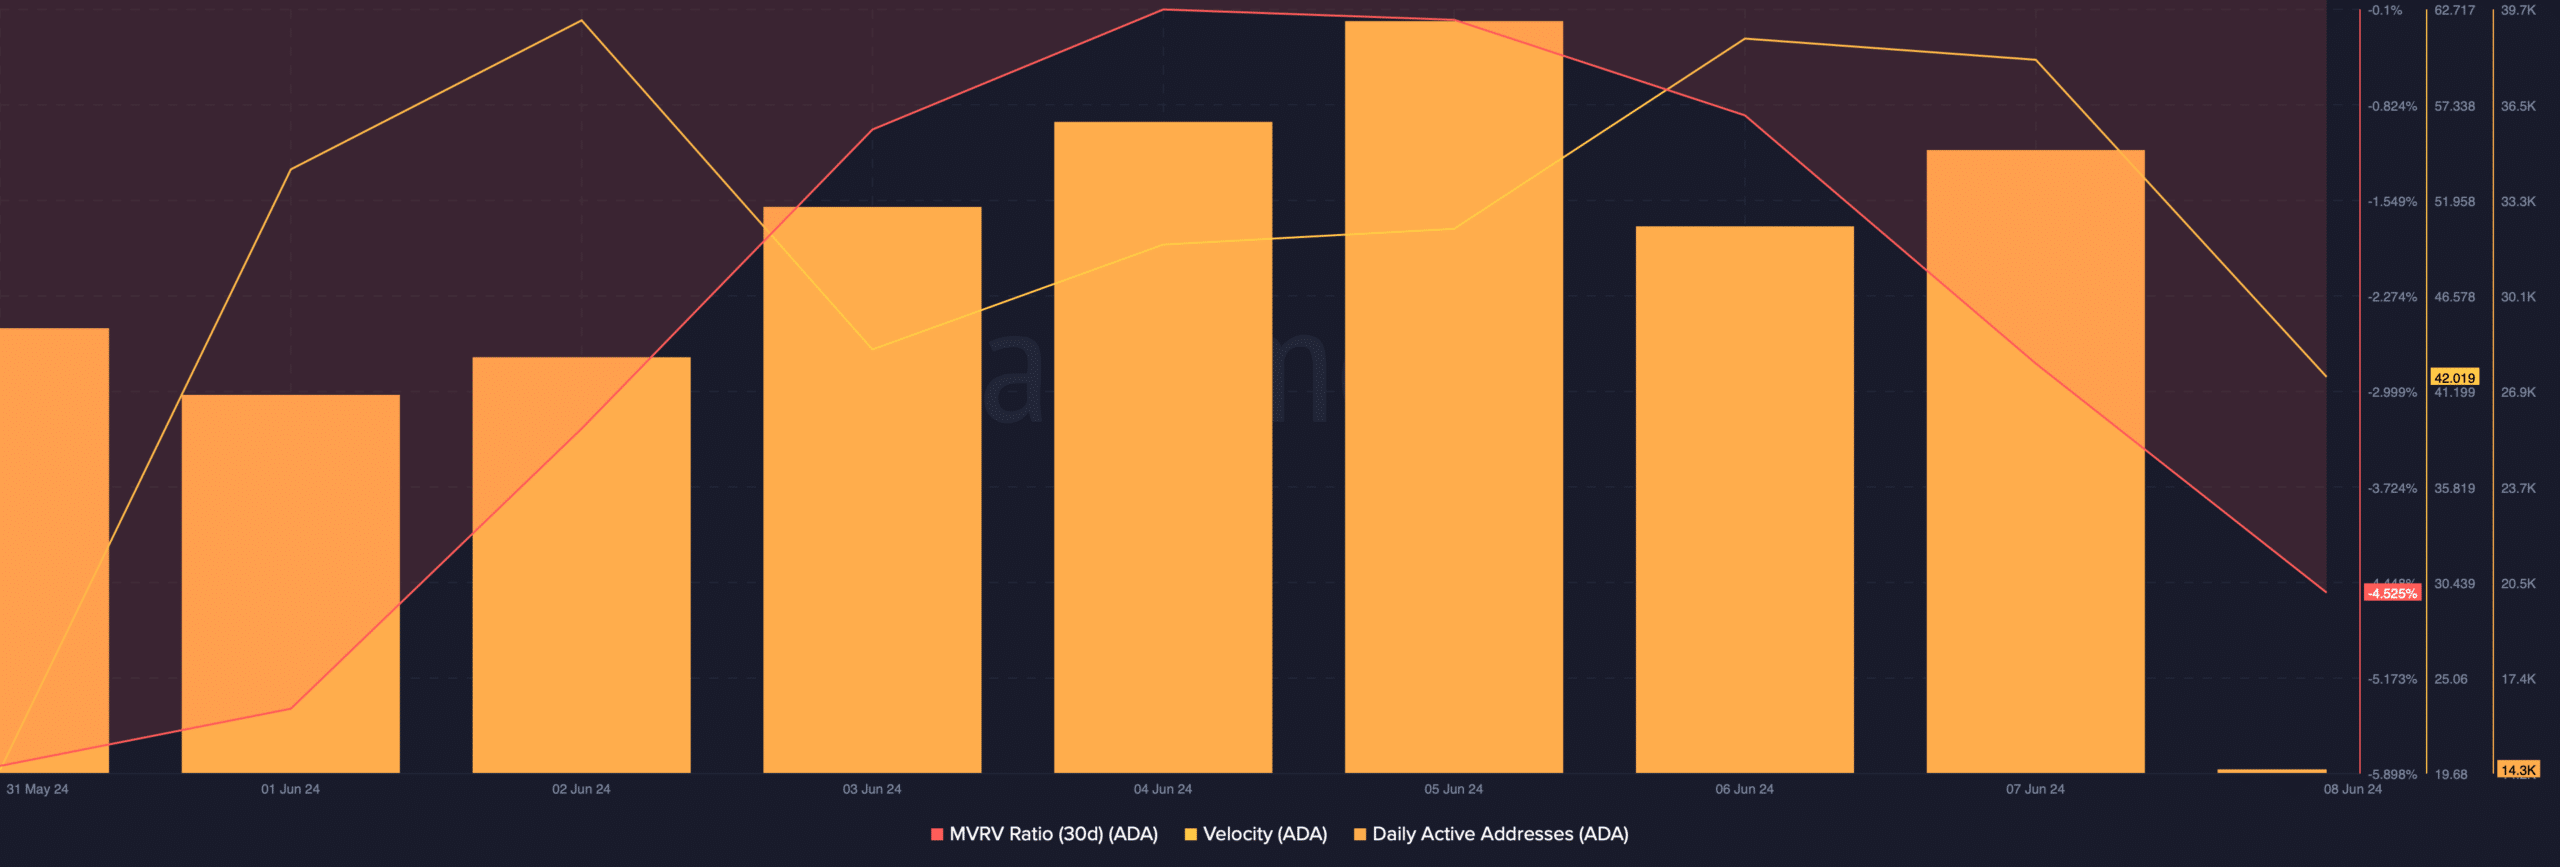
AMBCrypto then analyzed how metrics were affected because of the price correction. As per our analysis of Santiment’s data, Cardano’s MVRV ratio dropped because of the price dip.
Its velocity also declined on the 7th of June, meaning that ADA was used less often in transactions within a set timeframe.
Nonetheless, the blockchain’s network activity remained high as its daily active addresses increased.


Source: Santiment
Is your portfolio green? Check out the ADA Profit Calculator
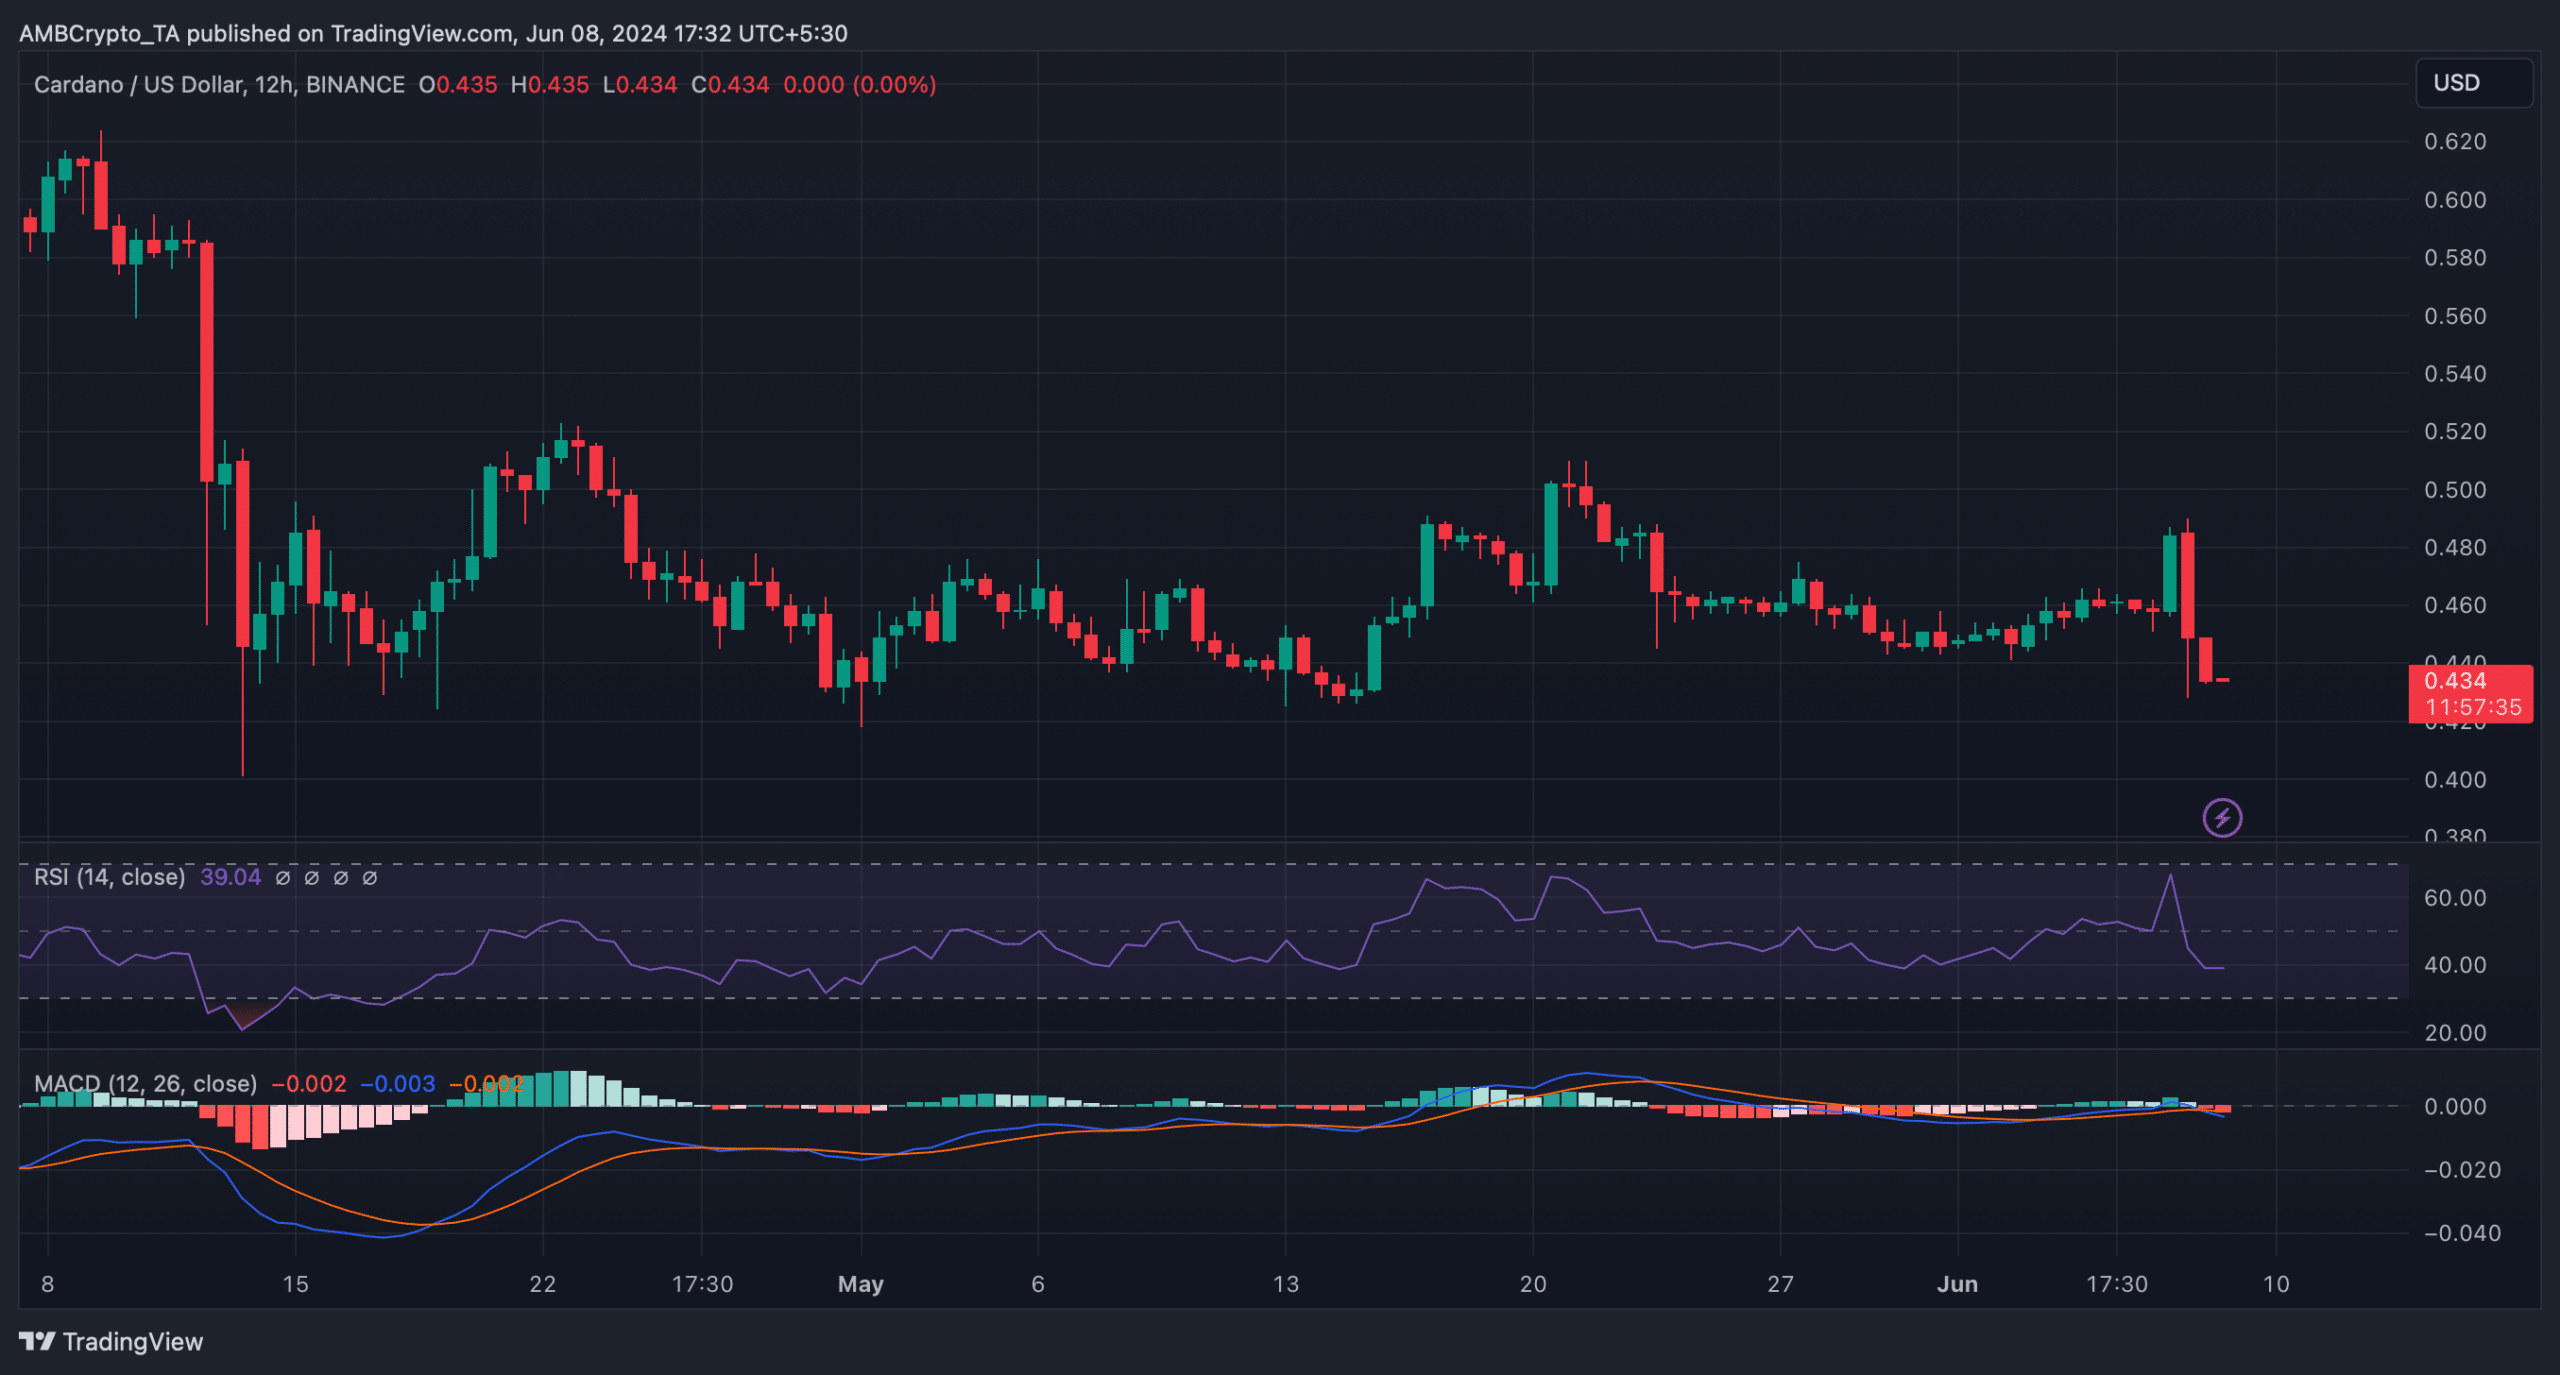
AMBCrypto then analyzed ADA’s daily chart to see whether indicators hinted at a price increase. Our analysis revealed that the MACD displayed a bearish crossover.
Its Relative Strength Index (RSI) also registered a sharp downtick, suggesting that the chances of a further downtrend were high.


Source: TradingView


