- Solana has a bullish structure after its deep retracement.
- A retest and rally is expected in the coming weeks, marking the former resistance as a “buy” zone.
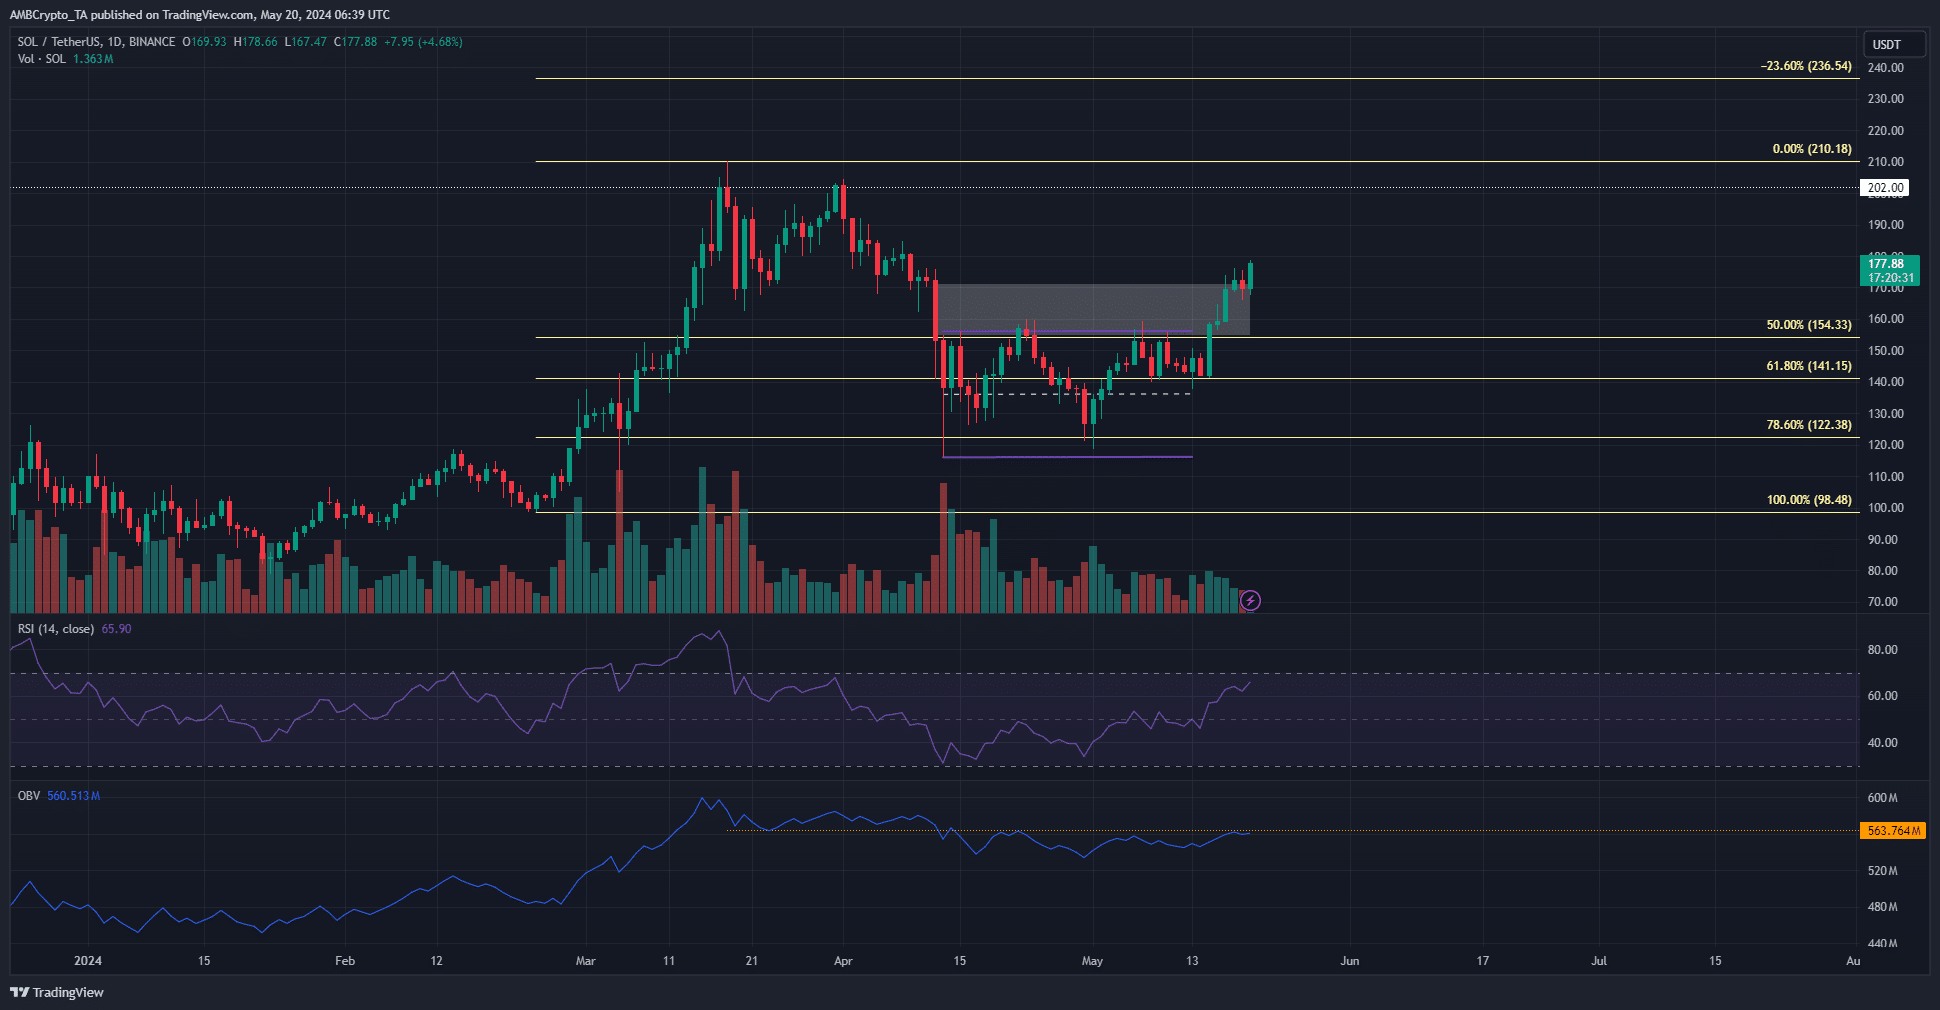
Solana [SOL] broke out past the $160 resistance zone and cleared the imbalance above the month-long range. In doing so, it asserted the previous higher timeframe uptrend.
The $160 area would likely serve as support going forward.
A recent AMBCrypto report highlighted that the social metrics were underwhelming. The network also surpassed Bitcoin [BTC] in terms of revenue generated in 24 hours.
Are the bulls strong enough to sustain the rally?


Source: SOL/USDT on TradingView
The daily market structure remained bullish despite the retracement to $122 in April, but the internal structure was bearish. This was flipped bullishly as well when prices closed above $160.
The RSI on the daily chart also climbed convincingly above neutral 50 to highlight upward momentum.
Yet, the OBV was unable to scale a local resistance level. The trading volume was also reduced, which was especially surprising since the $160 level was a critical local resistance level.
Together, the volume indicators posed some concerns for the buyers. A retest of the $160-$165 region as support is expected. This should be a buying opportunity.
The Fibonacci extension levels at $210 and $236 are the next targets.
Bullish speculation spurs SOL higher
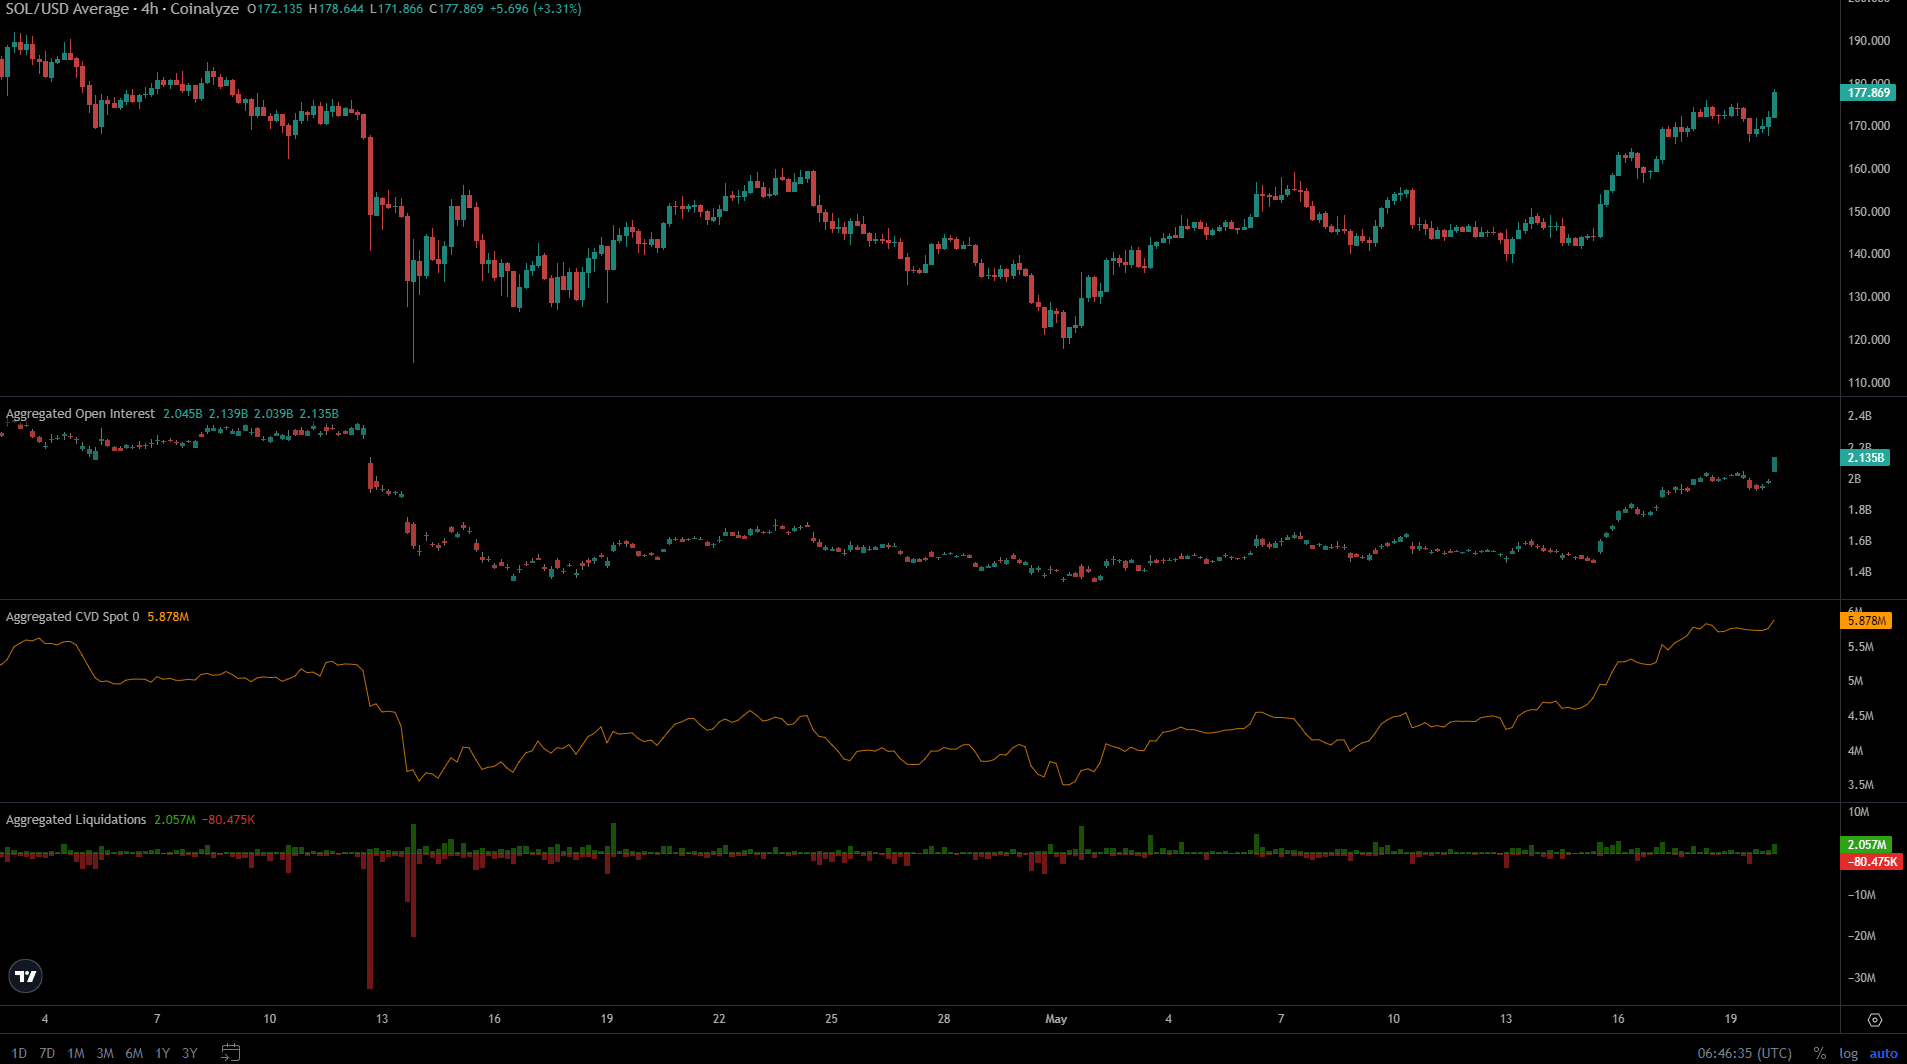
The Open Interest chart has climbed by more than $400 million in the past week. This was accompanied by a bullish price breakout, highlighting eager bulls in the futures market.
Read Solana’s [SOL] Price Prediction 2024-25
The spot CVD was also in a strong uptrend in the past two weeks.
Hence, even though the OBV saw obstacles, the spot market demand was high and could sustain the current rally. The short liquidations were small but consistent in recent days, which further fueled the price hike.
Disclaimer: The information presented does not constitute financial, investment, trading, or other types of advice and is solely the writer’s opinion.


