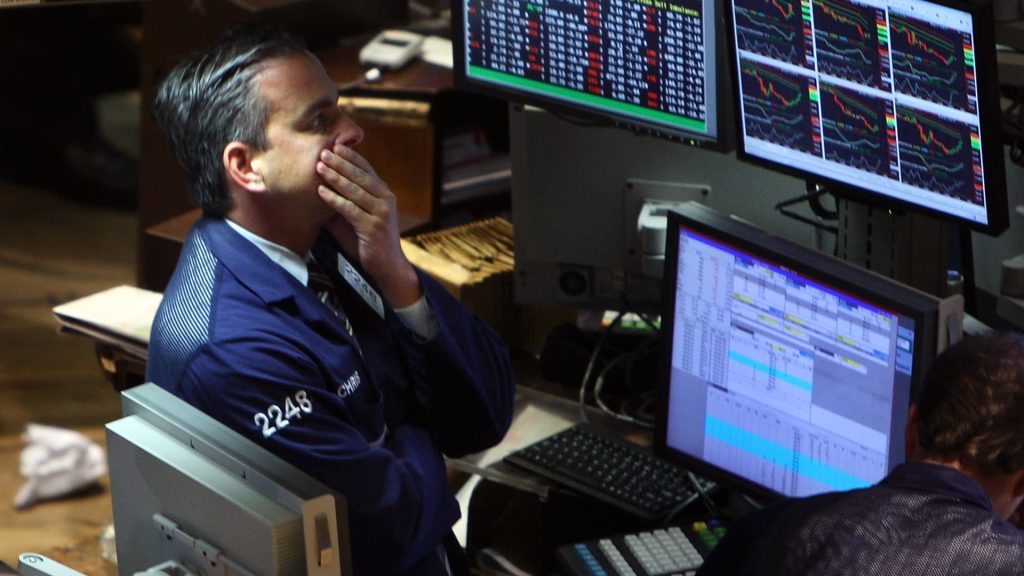
Several major fear indicators in the market reflect growing investor anxiety. The Cboe Volatility Index, a gauge of expected market volatility known as Wall Street’s “fear gauge,” topped 19 on Monday to close at its highest level since October. It approached the key 20 level in late fall 2023 and at other times during the pandemic when traders feared a stock correction. @VX.1 1Y VIX mountain over the past year At the same time, the CNN Fear and Greed Index moved into “fear” territory this week. A week ago, the market sentiment indicator was in the “neutral” zone, but a month and a year ago it was in a comfortable “greed” range. The index, which combines seven different metrics, including put and call options and demand for junk bonds, has five labels ranging from “extreme greed” to “extreme fear.” When the average score falls below 50, as it has in recent days, it can be taken as a sign that investors are getting nervous. And the so-called Goldman Sachs trading desk panic index rose to levels not seen since early 2023. It previously reached this point during the 2022 market sell-off. Taken together, the data underscores growing nervousness among market participants. The move comes as markets take a breather from the rally while concerns grow over the possibility of further interest rate hikes and escalating conflict in the Middle East. The market has been thrown “a fly in the ointment by this fear,” said Alex McGrath, chief investment officer at NorthEnd Private Wealth, citing the situation in the Middle East, as well as stretched market valuations and interest rate dynamics. “You have so much up in the air right now.” Monetary policy has been in the spotlight for more than a year as investors wondered when or if the Federal Reserve would begin cutting interest rates after a historic rate-tightening campaign. Fed fund futures traders are forecasting the first rate cut to come in September, according to CME’s FedWatch tool. This is much later than market participants expected at the beginning of the year. Those hoping for a rate cut sooner rather than later were dealt a major blow when closely watched economic data was released last week. On an annualized basis, price indexes linked to both consumers and wholesalers showed inflation remained above the Fed’s preferred 2% target, fueling concerns that borrowing costs could remain high longer than previously expected. That contributed to the market’s recent decline as major indexes retreated in April from record highs reached earlier this year. Since the start of the month, the S&P 500 is down more than 3% and the Nasdaq Composite is down nearly 3%. The Dow Jones Industrial Average could fall nearly 5% over this period. .DJI .SPX,.IXIC Mountain since the beginning of the year. Three major indices in 2024. This latest decline has brought the Dow Jones Industrial Average close to its 2024 flat line, a stunning reversal after trading near the key 40,000 level just a few weeks ago. Treasury yields also rose, with the 10-year note topping 4.6%. Rising oil prices also weighed on the stock market as commodity traders bought into expectations of deepening conflict in the Middle East. Iran launched hundreds of drones and missiles at Israel on Saturday, although the attack was largely thwarted by the latter’s defenses. Now traders are waiting for Israel’s reaction. The current market downturn shouldn’t be viewed as anything other than a typical and healthy correction just yet, said Jason Heller, executive vice president at Coastal Wealth. But he said the key threat to that outlook is that problems in the Middle East will continue to develop. “It’s very rare in a market that you can take an escalator — it’s usually an elevator ride,” Heller said. But “I always write in pencil when I give you forecasts because things can change.” “I think it’s just the natural ebb and flow of market pricing,” he added. “But there is a caveat: if things really go wrong in the Middle East, it could change the calculations.”


