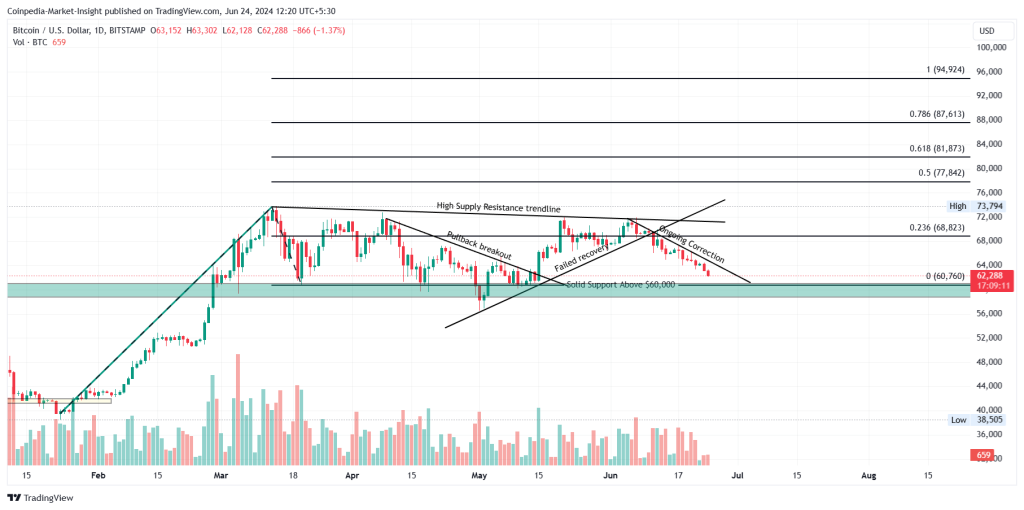
Following the massive bull run starting last September, the crypto market experiences a slump in Q2 2024. With the Bitcoin and Ethereum prices facing a healthy correction over the past few weeks, the bulls rest from exhaustion.
Currently, the BTC price is down by 15.59% from the all-time high of $73,794 and ETH by 18.15% of the $4,093 yearly high. Similarly, the crypto market is down by 18.77% from the $2.721 Trillion yearly high in March 2024.
As the crypto market correction continues, will the downfall in Bitcoin and Ethereum lead to new bottom formations? Or will the crypto prices take strong support for a bounce back?
Bitcoin Under Correction Eyes $60,000
With a bearish reversal from the dominant resistance trendline, the BTC price has dropped by 12.43% in the last 18 days. The downfall breaks under the 50-day EMA and leads to a new secondary resistance trendline.


With the crypto market in the correction phase, the BTC price continues to resonate above $60,000 support and the overhead trendline. This prolongs the flag pattern but weakens the possibility of breakout.
Currently, Bitcoin price trades at $62,219 with an intraday drop of 1.50% creating another bearish candle. Further, over the last 21 days, data from CryptoQuant shows $382 Million worth of long liquidation.
As the crypto price declines, the pressure at $60,760 support increases. In case of a breakdown, the BTC price can test the 200-day EMA at $57,971.
However, the reversal chances are significant with the bullish divergence as the RSI line approaches the oversold zone. With this reversal, the Bitcoin price may soon surpass the declining trendline and push past the 50-day EMA.
Hence, a bullish turnaround can reach the $68,823 mark.
Ethereum’s Downfall Heads To $3,000
Amidst the crypto market downfall, the falling wedge breakout rally in Ethereum takes a bearish step back. The sudden increase in supply close to the psychological mark of $4,000 aligns with the broader market crash.
The ongoing pullback continues in a range-based trend, with increased supply leading to breakdowns. Further, the ETH price breaking under the 50D EMA leads to a downtick and warns of a death cross if the downfall continues.
However, in the daily chart, a long-coming support trendline is ready to provide a bullish comeback. Further, the 200-day EMA aligns, increasing the reversal chances for the crypto.
Crypto Market Weakness Visible In ETH/BTC
In the weekly chart of ETH/BTC, a falling channel dominates the trend, with a death cross being a bearish sigil of a downtrend in motion. With this technical setup, Ethereum’s weakening position against Bitcoin is growing intense.
As Ethereum, the leading altcoin, shows signs of weakness, it could have a ripple effect across the crypto market. A bearish continuation within the falling channel can lead to decreased confidence amongst investors, prompting a shift of capital back to Bitcoin or even out of altcoins altogether.
How Low Will The Crypto Prices Fall?
Following the bearish week, the Bitcoin and Ethereum prices are approaching crucial support levels of $60,000 and $3,000. Hence, a drop below these critical levels will prolong the bearish continuation. However, the technical indicators with high demand at these crucial support levels could result in a bullish turnaround in the crypto market.
Also Check Out : Memecoins Bleeding: PEPE, WIF, BONK, BOME, & FLOKI Crash Hard: Here’s What You Can Expect by the Month-End!


