- XRP saw its lower timeframe market structure and momentum flip bearishly
- Despite the strong selling pressure, there is a chance of recovery
XRP has been rangebound over the last ten months. It formed a smaller range over the past two months and did not show signs of breaking out of this range at press time. In fact, the technical indicators suggested that a price bounce from $0.514 might happen.
Alas, this did not come to pass. XRP fell by 14.6% on 7 June, and it did so after bouncing by 10% from its lows, signaling a news-driven impulse move. What can traders expect from the altcoin next?
Lower timeframe mid-range was lost


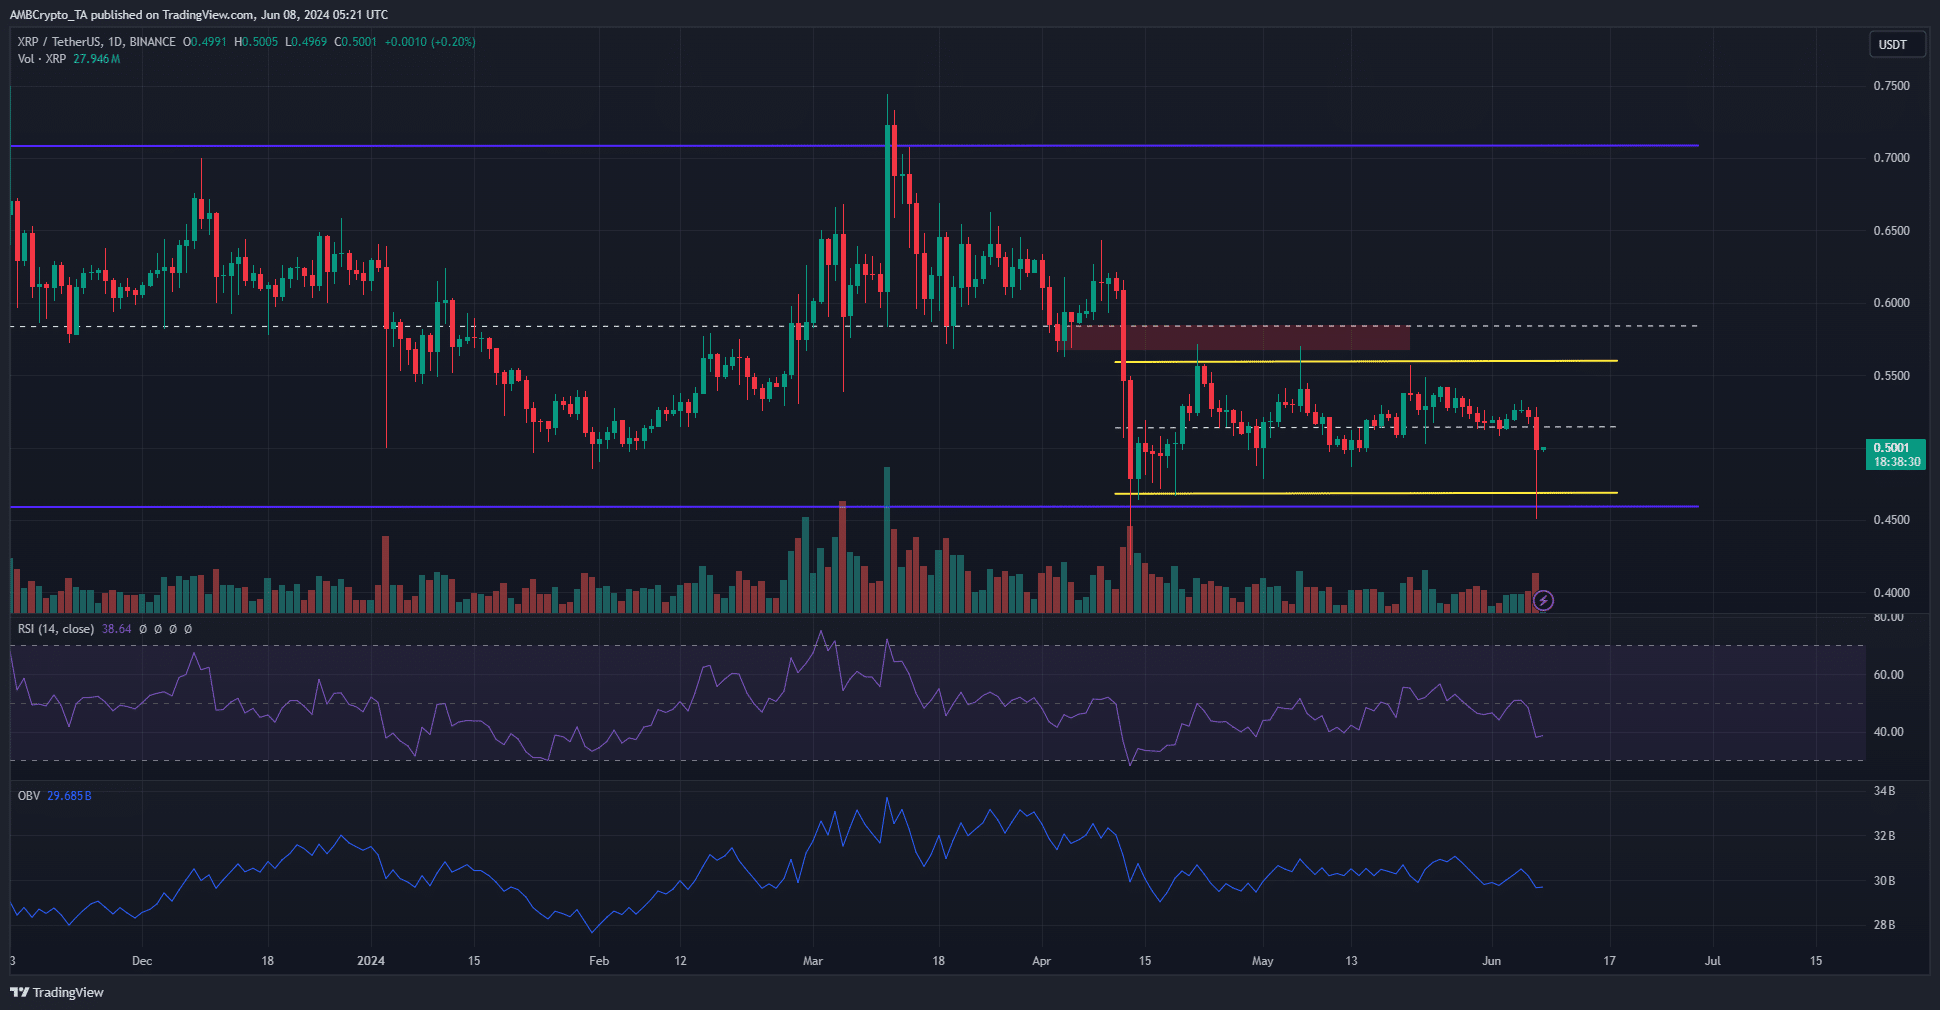
Source: XRP/USDT on TradingView
The two-month range (yellow) extended from $0.47 to $0.56. The mid-range level at $0.514 served as support earlier this week, but Friday’s Bitcoin [BTC] crash dragged XRP down. This flipped the lower timeframe structure bearishly.
The OBV has been on a downtrend since April. It tried to recover in May, but over the past ten days set lower lows. This revealed that even though XRP was above the short-term range’s mid-level, buying pressure remained weak.
The RSI on the daily chart was also below neutral 50, signaling a downtrend in progress. This, combined with the loss of the psychological $0.5 zone, could see XRP drop as low as $0.45.
Assessing the chances of another sharp drop
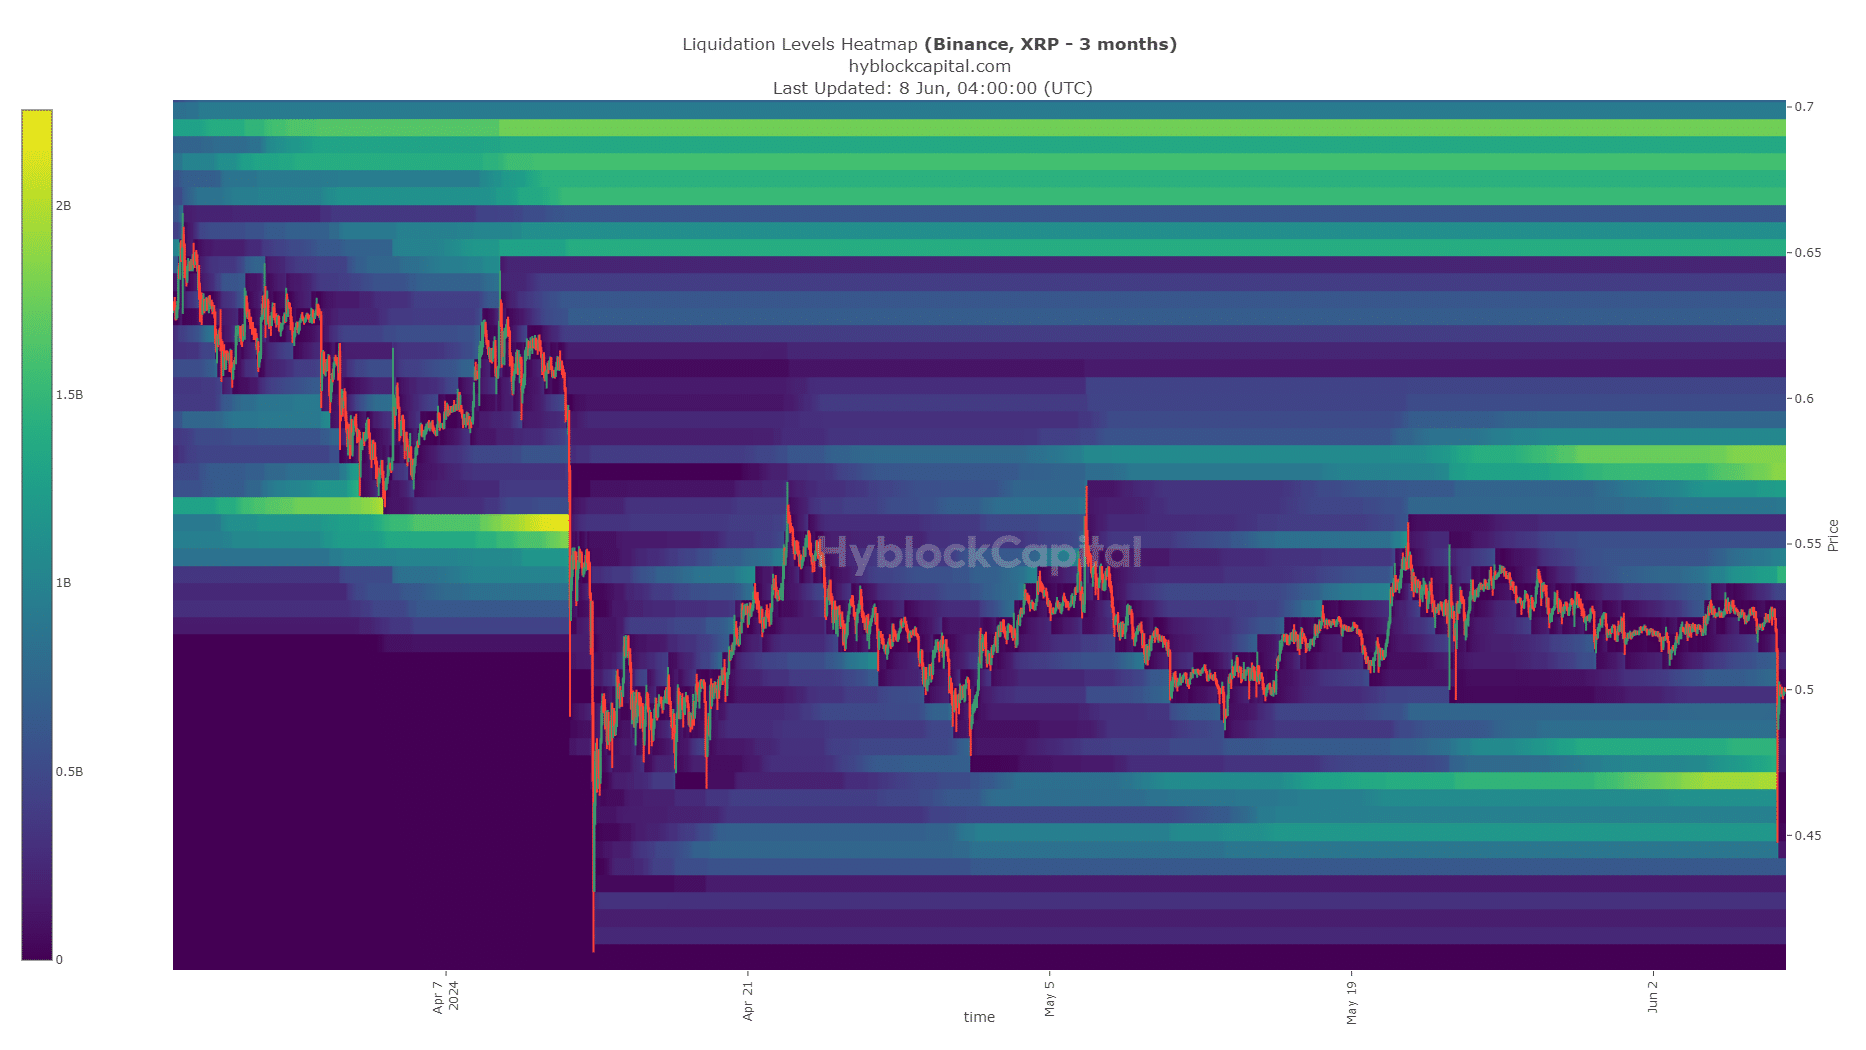
The price action chart and the technical indicators signalled bearishness. On the other hand, the liquidations chart revealed that traders might want to counter-trade the downtrend. The liquidity pockets down to $0.45 have been swept too.
Is your portfolio green? Check the Ripple Profit Calculator
The next large cluster of liquidity lies at $0.58, which is the mid-range level of the 10-month range. Therefore, though it would be counterintuitive, it seemed likely that XRP might surge towards $0.58 in June before another rejection.
Disclaimer: The information presented does not constitute financial, investment, trading, or other types of advice and is solely the writer’s opinion.


